Part 4: Assessing a Fishery’s Health: Stock Assessment
An initial step in preparing a Fishery Management Plan is learning about the fish stock the Council plans to manage. There is a lot to know about fish: quantity, age, fecundity, and maturity, for example. The Magnuson-Stevens Act requires that all stocks with Fishery Management Plans (FMPs) be assessed to determine if they are overfished, or are undergoing overfishing that could lead to a stock becoming overfished, and to develop a plan to rebuild if that’s the case. NOAA Fisheries updates stock assessments for 175 of the most essential commercial and recreational fisheries based on any assessments performed during the previous quarter.
Stock assessment is a term that refers collectively to all of the activities that fishery biologists do to determine the condition, abundance, or status of a stock. The result of a stock assessment is a report on the health of a stock and recommendations for actions to maintain or restore the stock, as needed. Stock assessments identify whether a stock is healthy, overfished, undergoing overfishing, or rebuilt, and the results of the assessment are publicly available.
Stock assessments are necessary because fish are a free-roaming common resource. A cattle rancher will know how many heads she has and where they are and what grazing the area will support. There is no similar knowledge in fishery management. Instead, there is uncertainty for much of the data fishery management plans have to rely on. Fishers are an important source of this information. The better the information from the fishing community, the more accurately an FMP can be designed.
Best Available Scientific Information
The Magnuson-Stevens Act requires managers on Fishery Management Councils to use the best available scientific information (or data) when making stock assessments. This is required by National Standard 2 (see below for a discussion on National Standards). Managers rarely know with certainty everything that should be known about a stock when making an assessment. However, an agency does not have to stop in its tracks when it does not have the information it needs. According to the U.S. Supreme Court in Bennett v. Spear, the “best available” standard does not mean that everything about a stock must be known; instead it means that managers must base assessments on the best information that is offered.
Best Available Science
According to one court, best available means NMFS does not fail to comply with the Magnuson-Stevens Act simply because the science is not sufficiently sophisticated. NRDC v. Evans, 254 F. Supp. 2d 434 (S.D.N.Y. 2003).
Another court found that a limited modeling tool supplemented by data from scientific studies to fill the gaps left by that modeling was enough to satisfy the best available data standard. Oceana, Inc. v. Evans, 384 F.Supp.2d 203 (D.D.C. 2005).
In a third influential decision, the court said “imperfections in the available data do not doom any agency conclusion…The agency's conclusion need not be airtight and indisputable.” Blue Water Fishermen's Ass'n v. NMFS, 226 F. Supp. 2d 330, 338 (D. Mass. 2002).
Some fishers view the best available data principle with skepticism. In the past, when managers asked for more and better data from fishers, the result was more restrictions on fishing. Therefore, some in the industry may think that providing information is against their interest to catch the most fish: the more they tell managers about a stock, the less stock they are allowed to catch. However, the information is used to ensure a fishery’s long-term health so people can continue to fish. When fishers do not provide good data, and managers must rely on incomplete information, one of two things can happen: overly restrictive management may limit harvests below what could be sustained; or overly permissive management may result in overfishing and declining catches. It is in the long-term interest of fishers to provide the best data possible so that catch limits are calibrated to the health of the fishery.
 Pacific Bluefin Tuna
Some Basics
Stock assessments include the results of two nearly separate activities. One is to learn as much as possible about the biology of the species in the stock. The other is to learn about the fishing activities for the stock. Typically, a stock assessment is required because a stock is already in decline as evidenced by lower harvests or reports of higher fishing efforts to get the same number of fish. The first time a stock assessment is conducted, there may be little or no information on the biology of the species or the fishery. In this situation, preliminary stock assessments are issued to provide initial management recommendations until more information is available.
Stock assessments do three things according to NOAA:
- Describe the past and current status of a fish population;
- Answer questions about the size of the stock; and
- Help predict how a fishery will respond to management measures.
Information Needed for a More Complete Assessment
Fishery biologists and managers always wish they knew more about the fish and the people catching them. A full assessment includes some of the following information about the fishery:
- The various sectors in the fishery (e.g., longliners, rod and reel, netters, recreational anglers, etc.).
- Pounds of fish caught by each kind of fishing over many years.
- Fishing effort expended for each kind of fishing over many years.
- The age structure of the fish caught by each fishing group.
- The ratio of males to females in the catch.
- How the fish are marketed (preferred size, etc.).
- The value of fish to different groups of fishers, both economic and recreational.
- The time and geographic area of best catches.
The biological information includes:
- The age structure of the stock.
- The age at first spawning.
- Fecundity (average number of eggs fish can produce at each age).
- Ratio of males to females in the stock.
- Natural mortality.
- Fishing mortality.
- Growth rate of the fish.
- Spawning behavior (time and place).
- Habitats of recently hatched fish (larvae), of juveniles and of adults.
- Migratory habits.
- Food habits for all ages of fish in the stock.
- Estimate of the total number or weight of fish in the stock.
When the above information is collected by examining the landings, it is called fishery-dependent data. When the information is collected by biologists through their own sampling efforts, it is called fishery-independent data. Both methods contribute valuable information to the stock assessment. However, biologists rarely have the resources to collect a large number of samples of fish over large areas. As a result, there is a high reliance on fishery-dependent data for many Fishery Management Plans.
Assessing Overfishing
The goal of gathering this data is to determine the health of the fishery so that management actions may be taken to establish sustainable stocks of fish. When the stock’s biomass is low, the stock can be defined as being overfished, although other factors must be considered as well. NMFS performs assessments to determine what is causing the overfishing, and what can be done to allow continued harvests. It is not as simple as knowing that too many fish are being harvested. There can be multiple types of overfishing with each type due to different stresses on the environment.
According to NOAA, current optimal capacity is not always the same as long run optimal capacity, particularly if the fishery resource is currently depleted and the management strategy is to rebuild the depleted resource. NOAA also describes fishing capacity as the maximum amount of fish over a period of time (year or season) that can be produced by a fishing fleet if fully-utilized, given the biomass and age structure of the fish stock and the present state of the technology.
Growth Overfishing
One type of overfishing is called growth overfishing. Growth overfishing occurs when the bulk of the harvest is made up of small, young fish that could have been significantly larger if they survived to an older age. The fishery would produce more by weight if the fish were harvested at a larger size. The question biologists, economists, managers, and others must answer is how much bigger or older should the fish get before they are harvested to reach optimum fishing?
Take a look at the Length-at-Age Key. The graph is typical of how most fish grow rapidly the first few years and more slowly later. One approach to get the most growth out of a stock of fish is to harvest them near the point where the growth rate begins to level off.

However, this approach is too simplistic because, as you see from the Age Structure of Stock Key, during the time that individual fish are growing in size, their numbers decrease due to mortality.
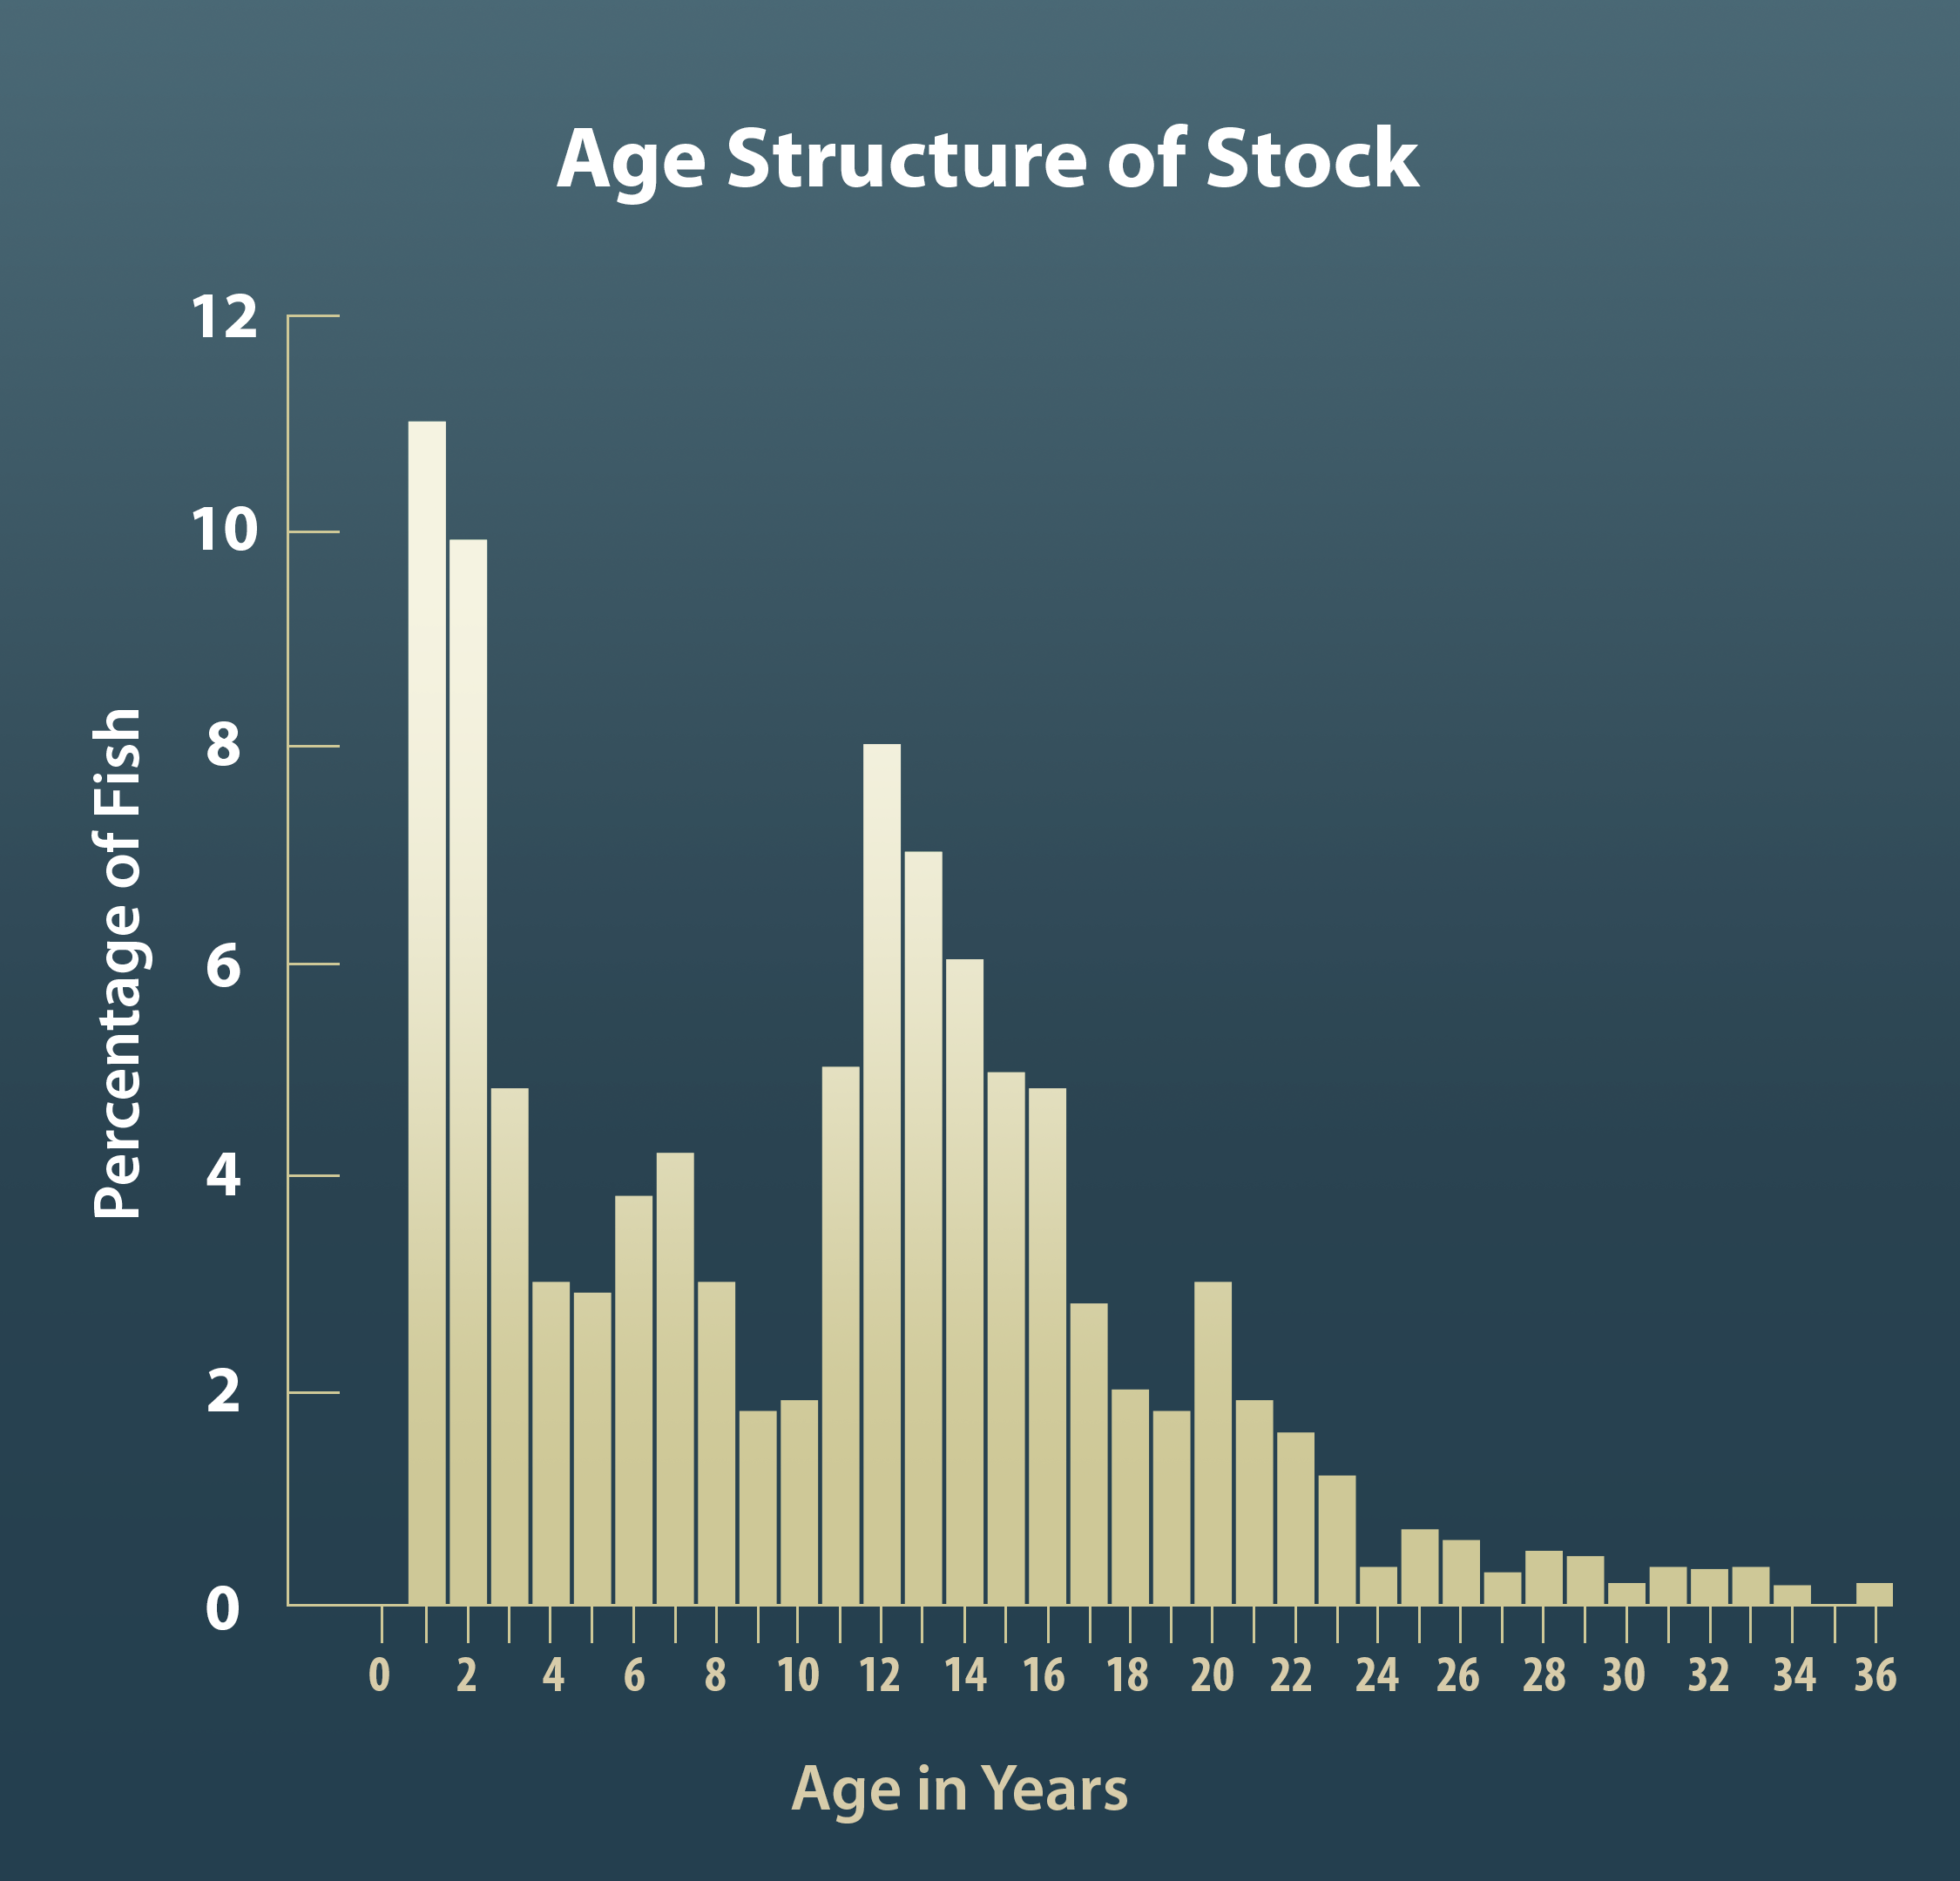
There are two opposing forces at work in a stock of fish. Growth increases the weight of fish, while mortality reduces their number. These forces can be illustrated by following a year class as they grow and die over a given number of years. Both the numbers of fish at each age and the total weight of the year class are graphed to give an accurate picture.
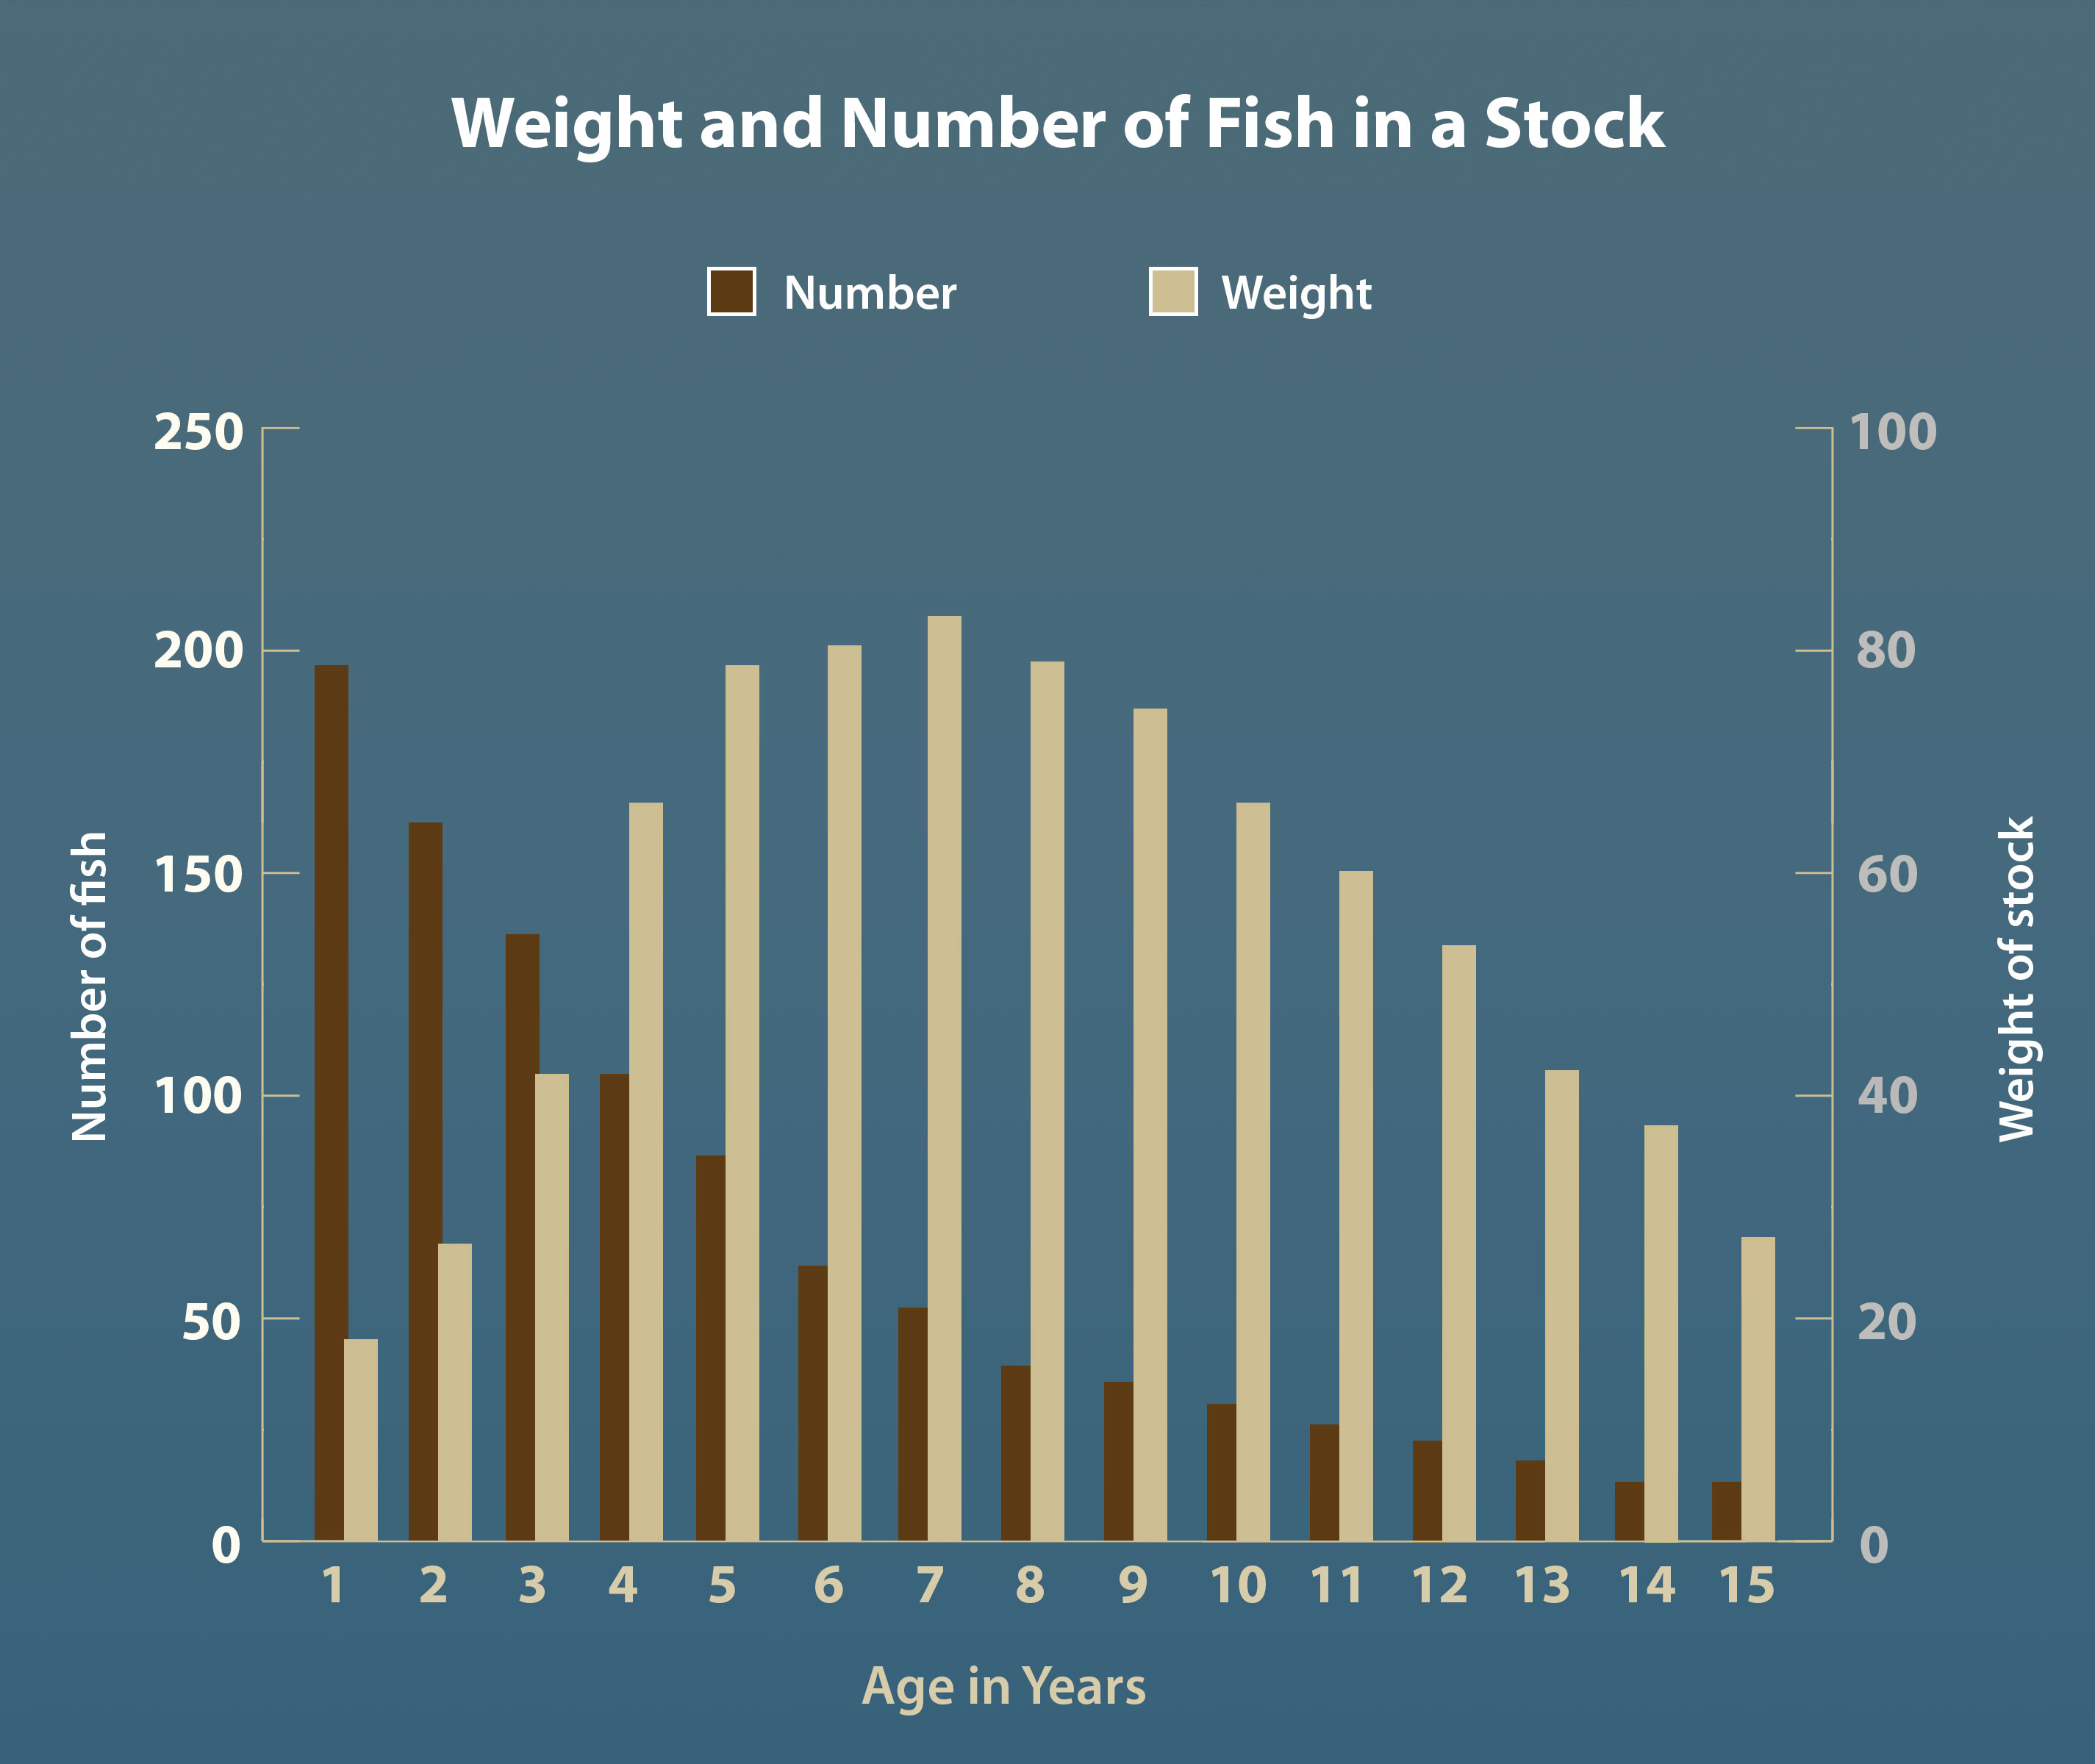
The shape of the curve in Weight and Number of Fish is determined by the growth rate and the mortality rate. As shown in Weight and Number of Fish, the weight of the year class of this species is greatest when this species of fish reaches six to seven years. In earlier years, there are more fish to be harvested, but they do not weigh as much. In later years, the death rate overcomes the growth rate and the weight of the year class declines.
Different rates of harvest (fishing mortality) will yield different curves. Using computers, fishery biologists can generate these curves to make a composite graph called a yield diagram. These diagrams show the yield (meaning the harvest) that can be expected from different combinations of harvest rates and the age of the fish when they are first captured. Because biologists often like to make calculations on a per-recruit basis, these graphs are often called yield-per-recruit diagrams.
 Queen Conch
Economic Overfishing
Another type of overfishing occurs when fishers catch fish before they reach their maximum price per pound. This is known as economic overfishing. The idea here is that when there is a premium paid for larger size fish, the overall catch will have a higher value if the harvest is delayed. For example, 50 pounds of 20-to-the-pound shrimp are worth considerably more than 100 pounds of 70-to-the-pound shrimp. As with growth overfishing, there is a point of maximum value of the stock. If that point is exceeded, for example, individual large shrimp may be more valuable but there will not be enough of them to equal the value of catching the more abundant but less valuable smaller shrimp.
Ecological Overfishing
Ecological overfishing is a type of overfishing where the environment is taxed to such an extent that fish stocks decline. Instead of focusing on one stock, ecological overfishing is found to occur when overall landings in a region (not just one fishery) exceed what the environment can sustain. This can be caused by large fishing operations involving significant bycatch and discarded offal, which disrupt the natural cycle of the marine environment.
While pollutants significantly contribute to the ability of a fishery to produce a healthy biomass – such as the annual dead zone in the Gulf of Mexico, in which upstream pollutants largely from agriculture along the Missouri-Mississippi River system choke oxygen from the Gulf of Mexico – as yet they are not classified as a cause of ecological overfishing.
More about Stock Assessments
There is a lot to know about Stock Assessments. The following sources are good places to learn more:
NOAA, Fish Stock Assessment 101 Series:
• Data Required to Assess Fish Stocks
• Stock Assessment Models
• More About Models
• Ecosystem Factors
• Future of Stock Assessments
What Is Stock Assessment? by Nicholas Fisch, Angela Collins, and Edward V. Camp
A Guide to Fisheries Stock Assessment from Data to Recommendations, by Andrew B. Cooper, University of New Hampshire
« Go to Part 3 | Part 4: Assessing a Fishery’s Health: Stock Assessment | Go to Part 5 »