Part 5: Assessing the Age of Stock
Aging Fish Helps Set Harvesting Levels
To understand a fish stock fully, biologists must know the age of fish when they first spawn. Then biologists assess the proportion of fish caught at certain ages, putting them into categories (i.e. one, two, and three years old). This is an example of fishery-independent data – where the information is gathered by scientists, and not the folks catching the fish. This information helps biologists understand a fishery’s capacity. Consider, for example, a fishery where some of the fish spawn when they are two years old, and all spawn at age three. If most of those fish are caught when they are two years old, there is a danger that too many fish will be caught before they can spawn and replace themselves. This practice is called recruitment overfishing. Fishery management is designed to prevent this.
How to Age a Fish
You cannot tell the age of a fish by looking at it, but the age of fish is important data in assessing the health of a stock. Some grow faster and get bigger than others, and there are many differences between species and also within a species. Fish are normally aged by examining bony parts such as otoliths (“ear bones”) that contain a record of growth like rings on a tree. Once it is established that each ring truly represents a year, then the age of a fish can be determined.
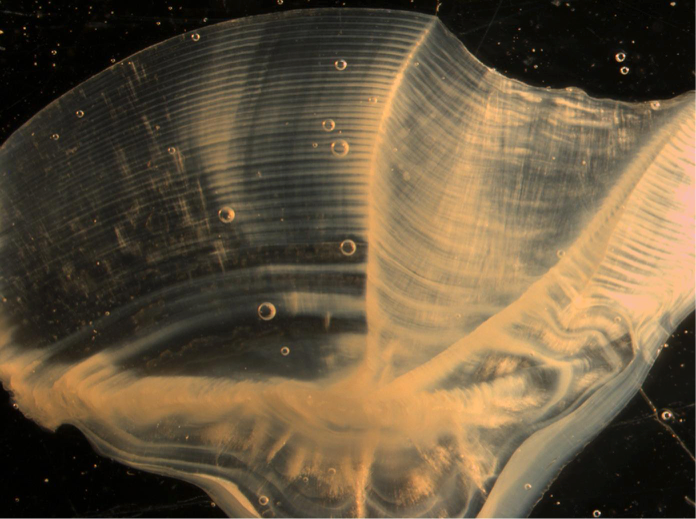 A red drum otolith section, as seen through a microscope. Scientists assigned an age of 33 years to this specimen.
Photo courtesy of Crystal Hightower, Dauphin Island Sea Lab Fisheries Ecology Lab.
The usual procedure for gathering age data of a stock is to obtain fish from fishers or from a fishery-independent sampling program. Once the fish age is determined by examining the otoliths, this information is used to compare the length and weight to the age of the fish. This results in a length-at-age key from which the age of other fish can be estimated from their length. (See the Length-at-Age Key in which each x represents the length of an individual fish.)
Learning the Growth Rate Helps Stock Assessment
Growth rate can be estimated by looking at the change in length and weight from a one-year-old fish to a two-year-old fish, etc. The more fish from a stock that are aged, the better the health. However, in the case of long-lived fish, growth usually slows in the older fish and past a certain point, the age cannot be readily assumed by the length of the fish. For example, it would be hard to tell the age of 20-inch fish in the Length-at-Age Key because a 20-inch fish could be between four and eight years old. In such cases it is better to age as many fish as possible by the otoliths than to rely on the length, especially in the larger, older fish.
A Catch Curve Shows Age of Recruitment
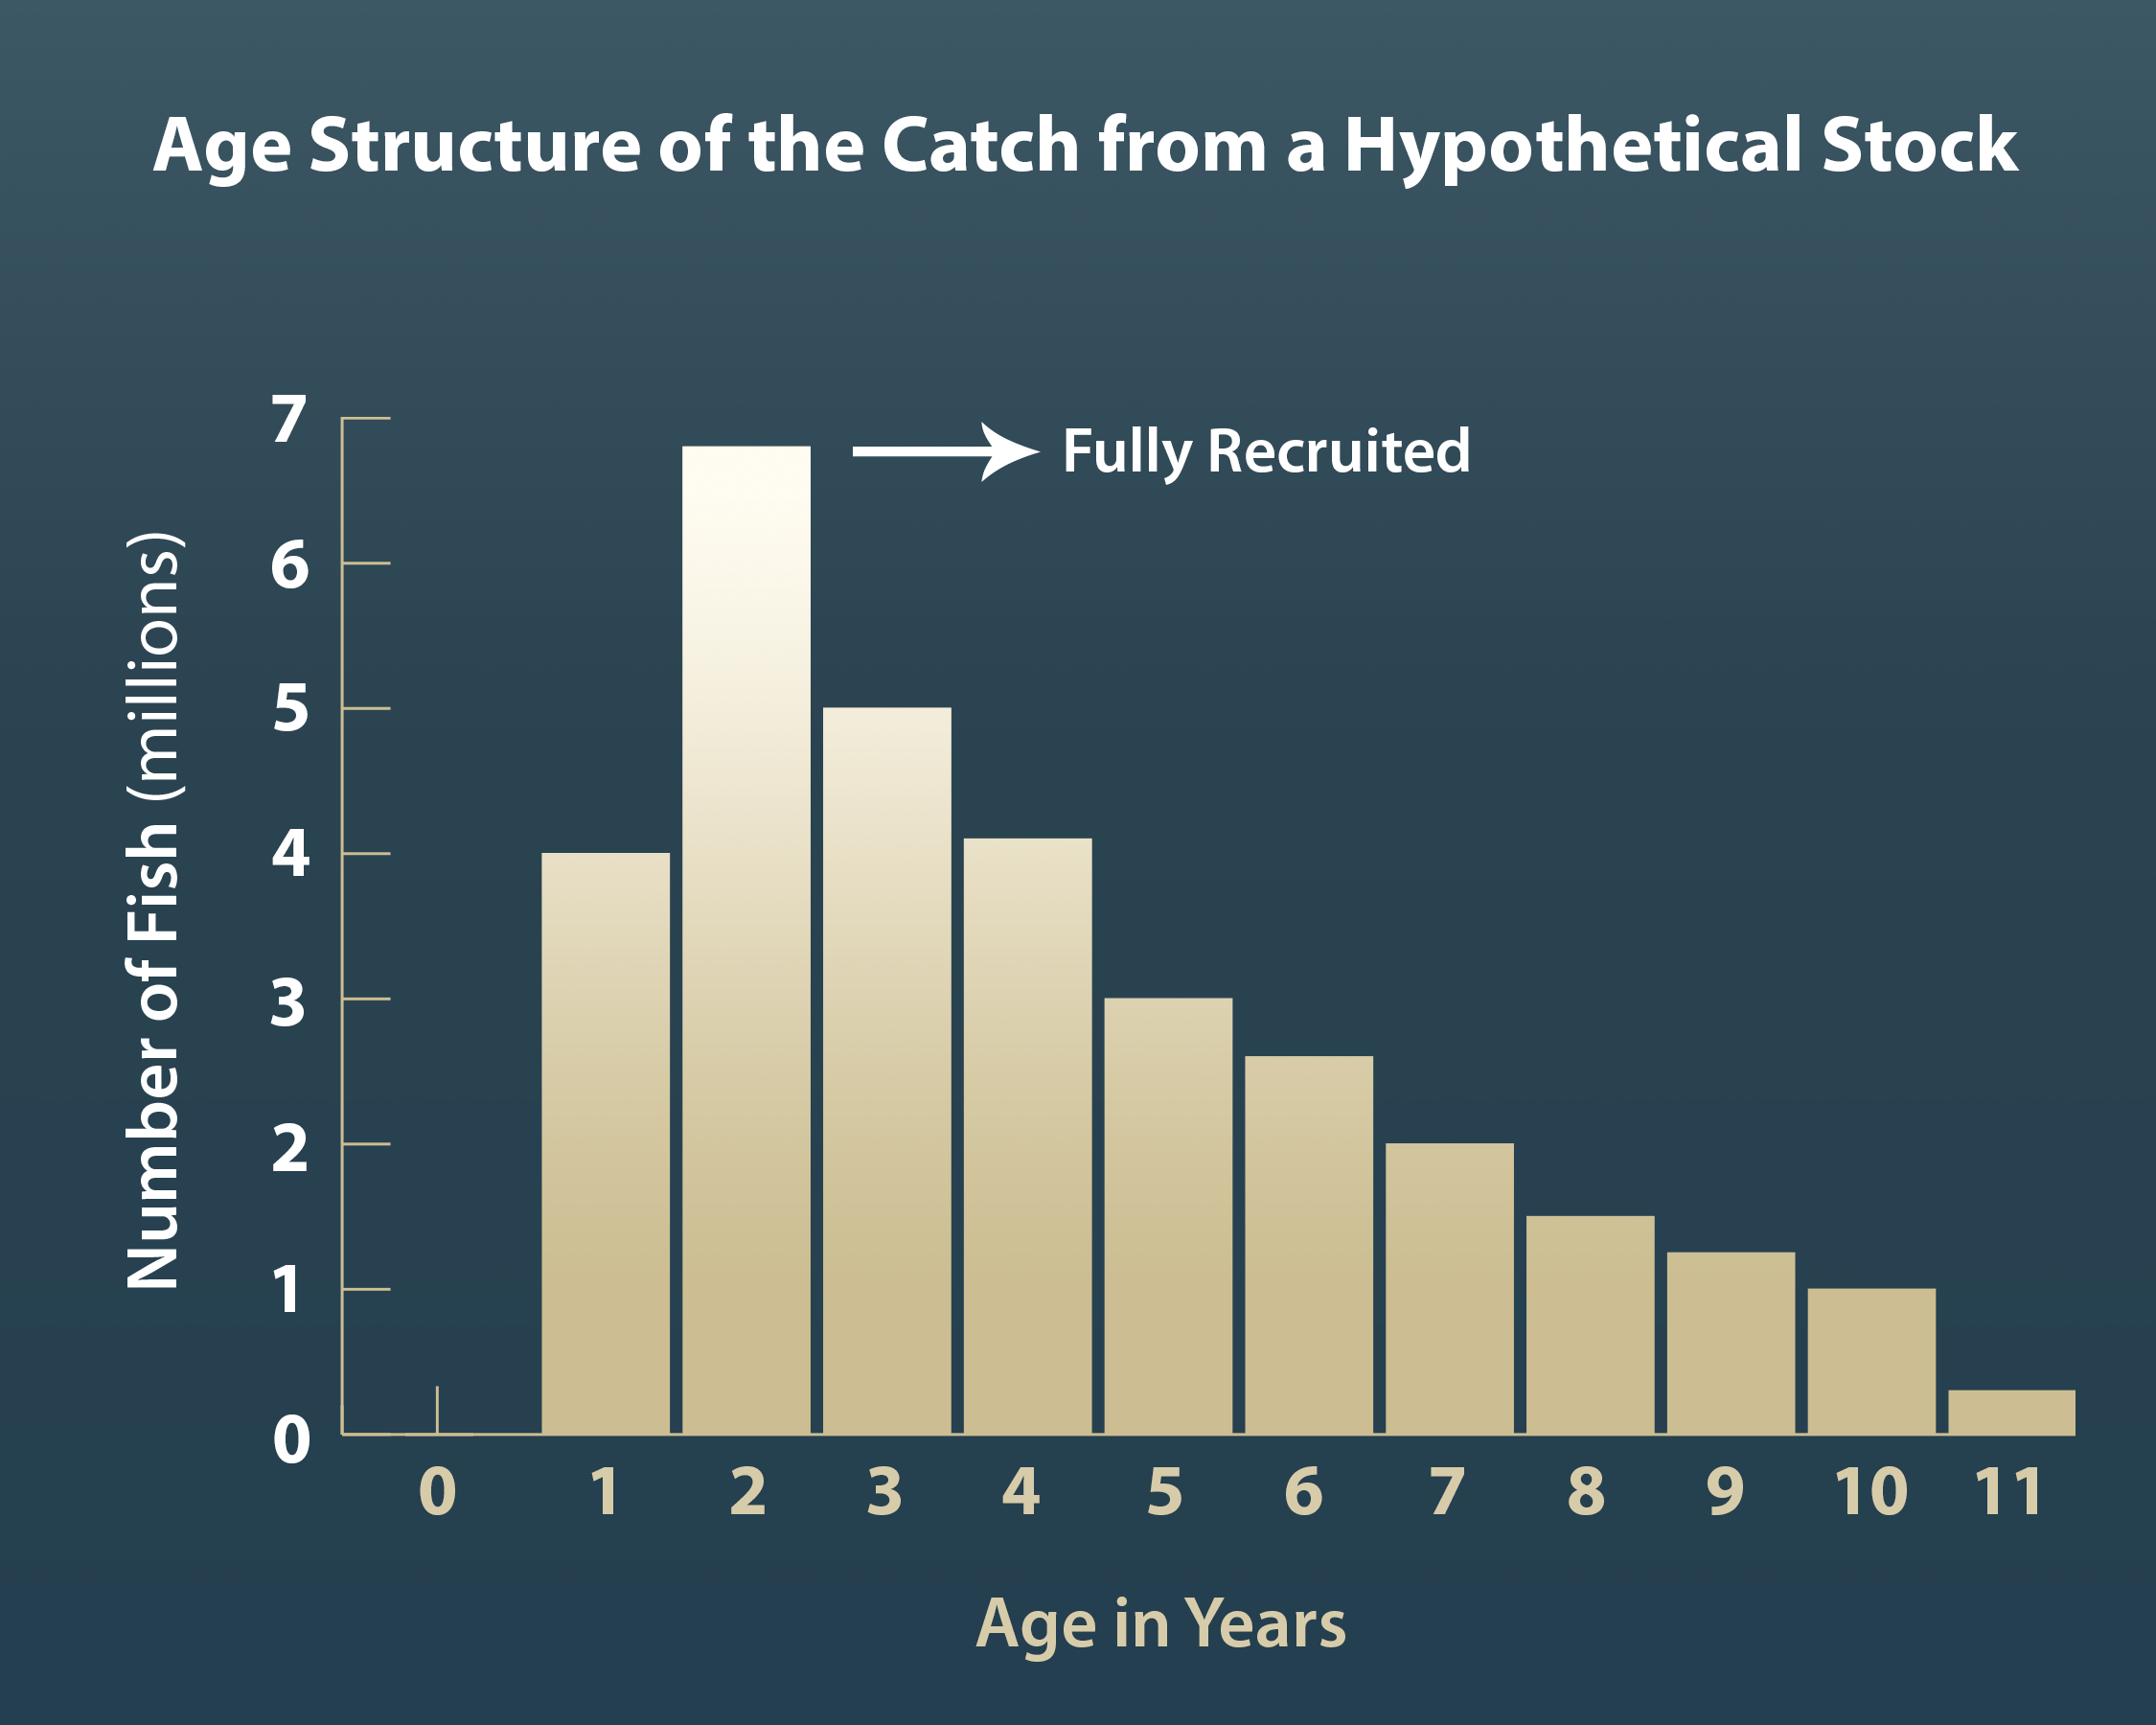
When enough fish have been aged, either directly or indirectly, a diagram called a catch curve of the age structure of the stock may be drawn (See Age Structure of the Catch from a Hypothetical Stock). It is based on the age of fish that are caught. Note that in the hypothetical stock in that chart there are more two-year-old fish than one-year-old fish. This does not seem to make sense. We expect to see that fish form a pyramid by age, with large numbers of younger fish at the bottom of the pyramid, and fewer fish at each subsequent age, as they die off due to fishing and natural mortality. However, fishers may not catch one-year-olds in proportion to their abundance, and so their true numbers do not show up on the chart. Also, the one-year-olds may not be abundant in the same areas as the older fish, they may not be caught by the fishing gear, or they may be caught but thrown back. When fishery biologists see a graph like this, they say that the one-year-old fish are “not fully recruited” to the fishery while the two-year-olds are considered to be “fully recruited.” A fish is identified as a recruit as of the first year it is readily harvested in a fishery.
A fishery assessment using the abundance of each age group is based on the portion of the stock that is fully recruited to the fishery. It is desirable to know more about the unrecruited stock between the time of egg fertilization to the age of recruitment, but for many species there is little that management can do that would affect this part of the population as they are not directly impacted by fishing activities. For other species, management could affect water quality, the amount of suitable habitat, or even the death rate (bycatch, power plant entrainment, etc.) to promote greater survival of young fish before they reach harvestable size (are recruited to the fishery).
 Pacific Wahoo
Age, Growth, and Death
Any reliable information about the fishing process or the biology of the stock contributes to the stock assessment. Among the basic biological pieces of information that fishery biologists find most useful are the distribution of different ages of fish in a stock and the relation between fish length and age. Once this is known, then important characteristics of the stock such as growth rate and death rate (mortality) can be determined. This information is used to describe the current status of the stock.
More Information from Age Structure
The age structure of a stock reveals insights about the current status of the stock as well its past history. The Age Structure of Stock graph illustrates the age structure of a hypothetical fish stock in 2020.
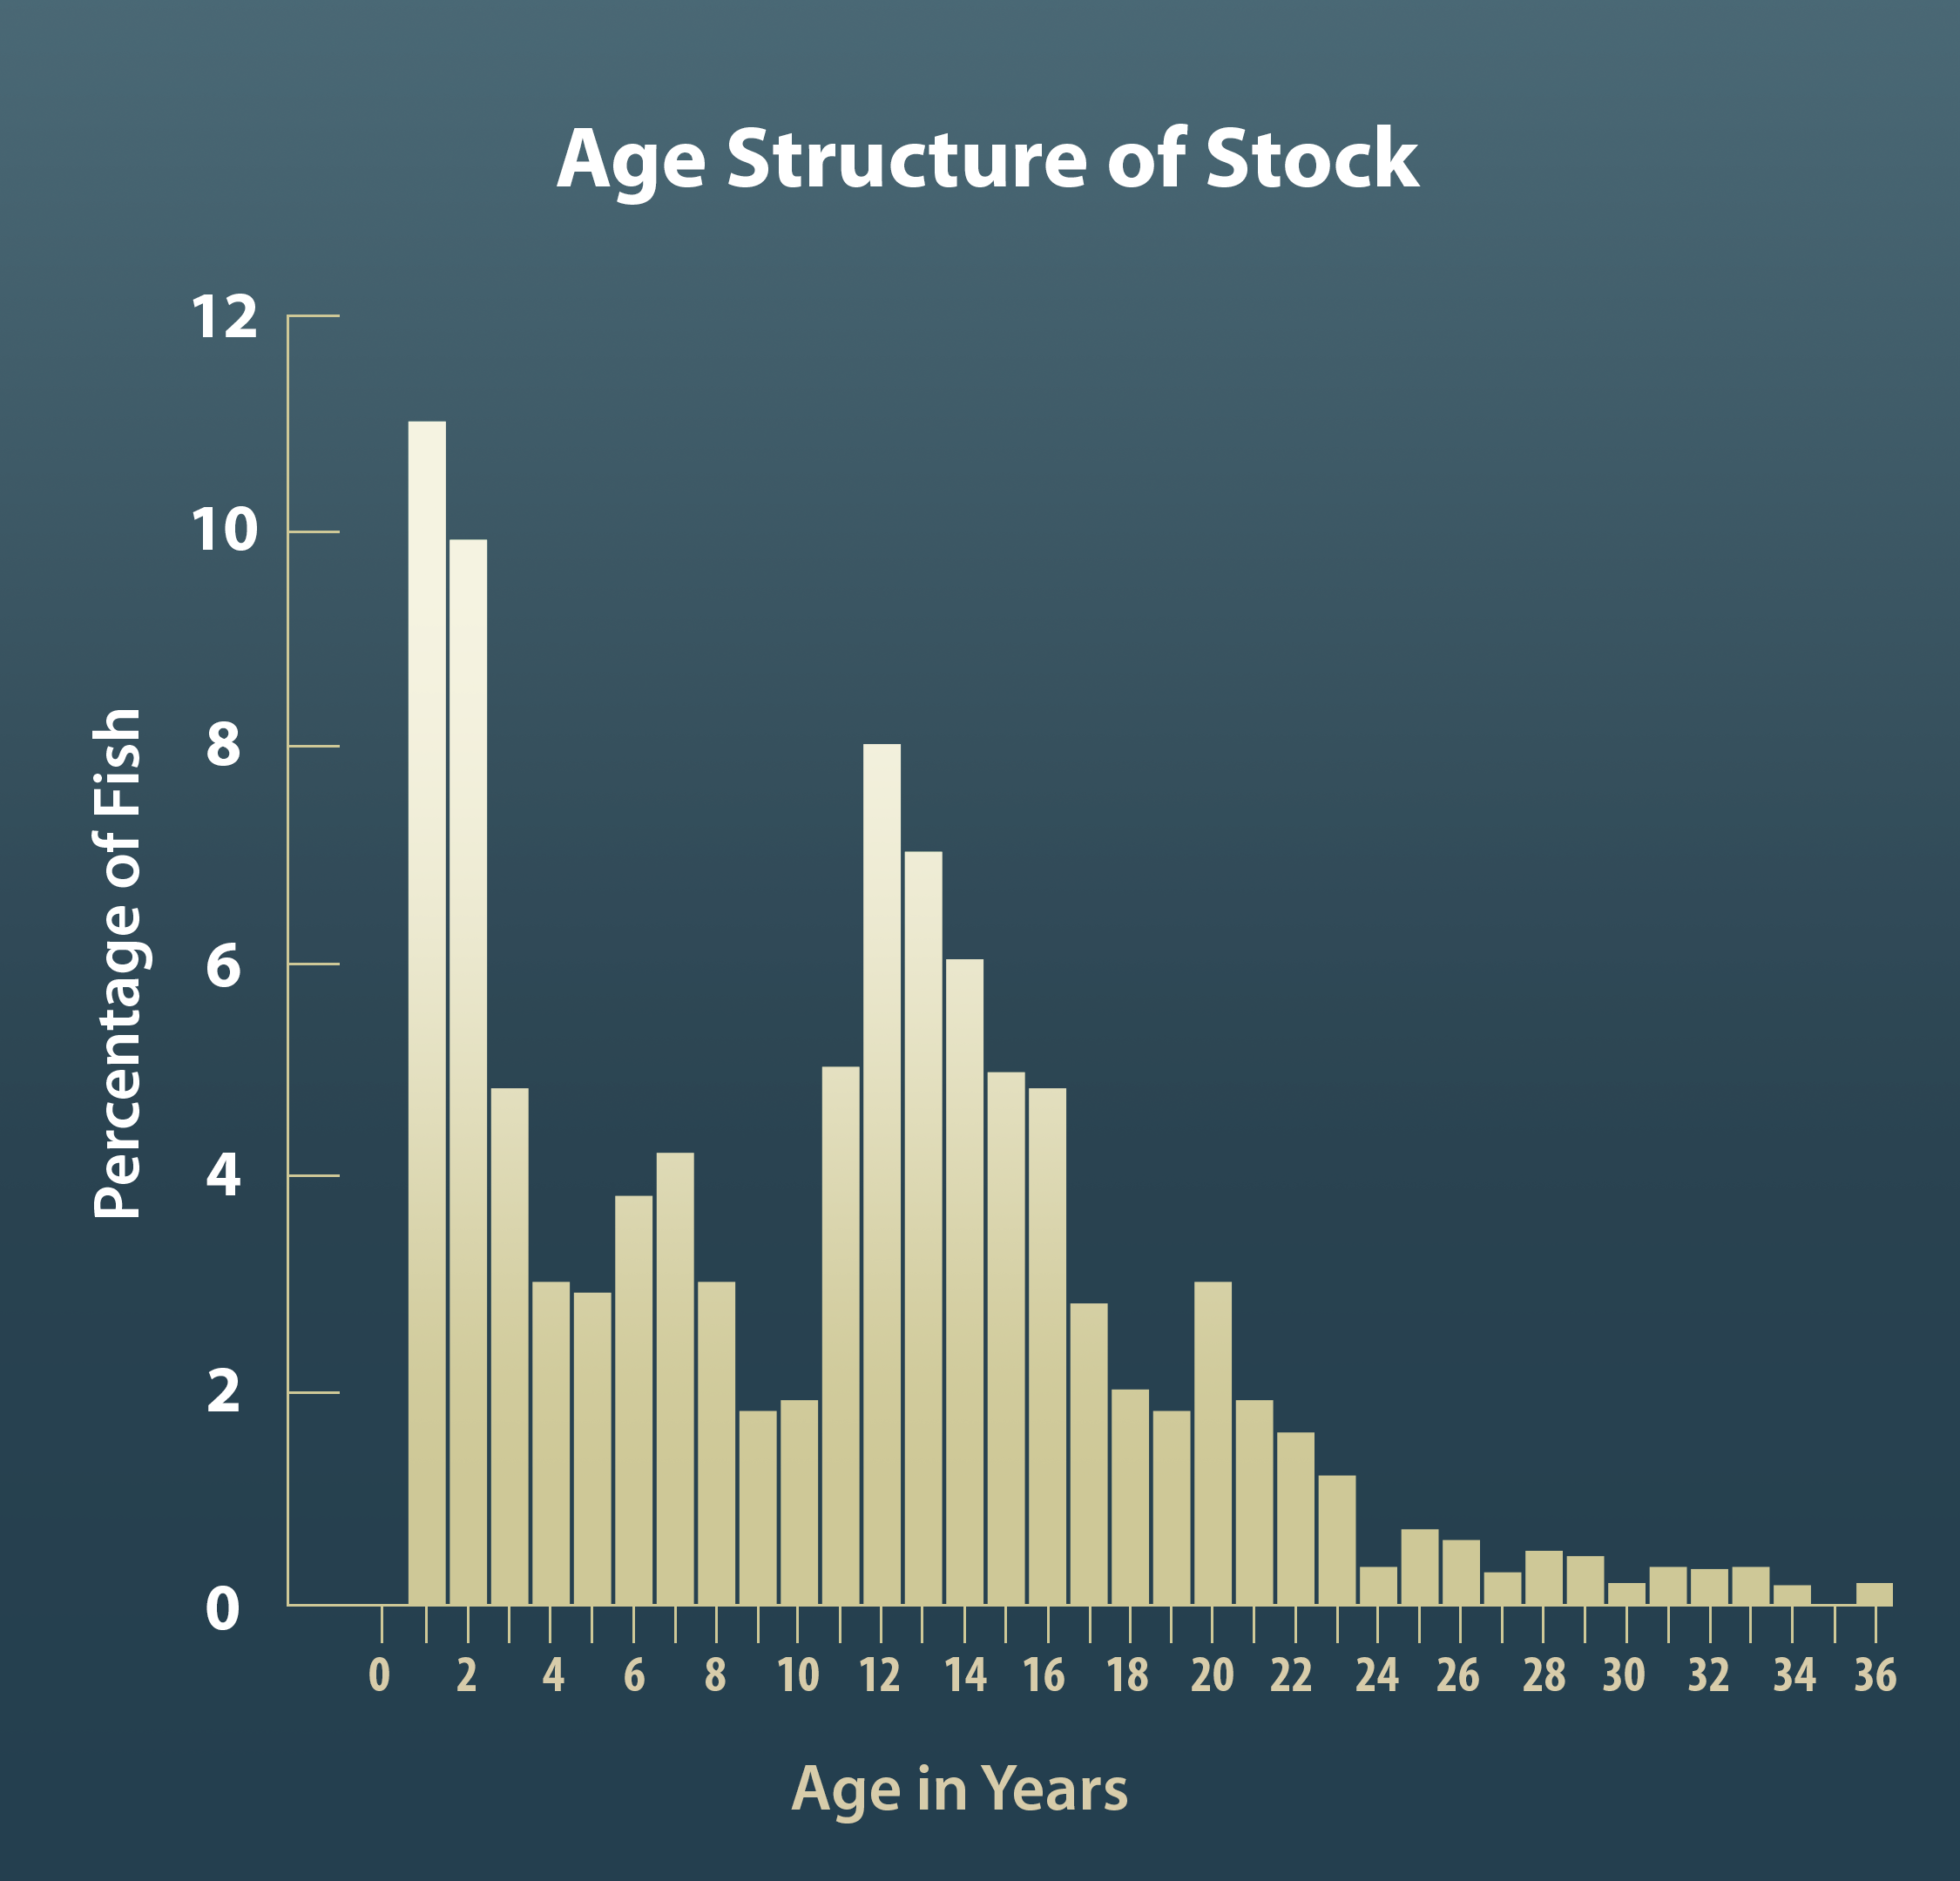
This graph demonstrates the following important information for that stock:
- The fish are harvested starting at one year of age.
- The species is a very long-lived fish – up to 36 years old.
- The number of fish at each successive age (two to three, three to four, etc.) does not follow a smooth downward trend, unlike the fish species shown in the Age Structure of the Catch from a Hypothetical Stock graph.
- Fish aged 3 to 11 appear to be particularly few in number. The 11-year-old fish were hatched in 2009 (2020 - 11= 2009). The 3-year-olds were hatched in 1997.
- Even though 1- and 2-year-old fish appear relatively abundant, if we look at the age structure of 12-year-old fish out to 23-year-old fish (hatched between 2008 and 1997) we can see that they have not declined in numbers at the same rate as ages three to eleven appear to have declined.
- This backward projection suggests that not only are there not as many 3- to 11-year-old fish as might be expected, but the number of 1- and 2-year-olds may be less than what existed in the 1990s to the 2000s. Fishery biologists take this kind of pictorial information and quantify it (put numbers on it) in order to further describe the stock and test ideas about the health of the stock.
While it provides valuable information for fish managers, the graph alone cannot tell us why these age classes appear low. There may be information from other sources that suggest that fish of these ages are targeted by fishing or there may have been fluctuations in climatic conditions (drought, flood, freezes, etc.) that affected the survival of these fish during certain years but not in others.
« Go to Part 4 | Part 5: Assessing the Age of Stock | Go to Part 6 »