Part 6: Assessing the Mortality and Spawning Potential Ratio (SPR)
Knowing how a species ages helps scientists calculate the health of the fishery. In order to set catch levels at a quantity that can be continually harvested without damaging the stock, Councils must determine how many – meaning individual fish – or how much – meaning pounds of fish – can be safely harvested from a stock. This means the Councils must know how many fish in a stock can die while still allowing the stock to maintain itself.
Calculating Mortality Rate
Mortality rate is the rate at which fish die, typically shown as a percentage. If 1,000 fish are alive at the beginning of the year and 200 fish die, leaving 800 at the end of the year, then the annual mortality rate is 20 percent (200 divided by 1,000) and the survival rate is 80 percent (800 divided by 1,000).
Harvesting some fish before they spawn does not automatically doom the stock, but it is one factor that needs to be evaluated. Declining landings, greater effort to catch the same or smaller amounts of fish, or declines in average size of fish are all signs of possible problems. Determining the age of spawning and the age of fish caught is one step toward better management.
Converting to Instantaneous Rates
Fishery biologists convert the average percentages to something called instantaneous rates to identify fish mortality related to time. Fishery Management Plans use that language. For example a plan might have a phrase like either of these: “The instantaneous fishing mortality rate is 0.67 (F=0.67)” or “The instantaneous natural mortality rate is 0.1 (M = 0.1).”
Each year some fish die whether they are harvested or not. The rate at which fish die of natural causes is called natural mortality and the rate at which fish die from fishing is called fishing mortality. Scientists use letters for these rates.
Z = M + F
For a fish population, the total mortality (Z) is the sum of fishing mortality (F) and natural mortality (M). Several methods are used to determine each mortality rate. For example, fishing mortality can be estimated from a tagging study. After a lot of fish from a stock are tagged, the percentage of tagged fish that are caught and reported is an estimate of the fishing mortality. Natural mortality is then calculated by subtracting fishing mortality from total mortality. Sometimes there is no available estimate of fishing mortality for a stock. (This is where having data from fishers helps.) However, in such cases fishery biologists may be able to establish the natural mortality by studying other similar stocks.
Once fishing mortality and natural mortality are known, they can be used to examine the effects of fishing on the stock. Natural mortality (M) (or a range of possible natural mortalities) can be subtracted from total mortality (Z) to get fishing mortality (F) (or a range of possible fishing mortalities).
Sometimes F includes a subscript, for example, FMSY. The subscript refers to maximum sustainable yield (MSY). Thus, FMSY is the fishing mortality rate that would result in the maximum sustainable yield for a stock of fish.
Where the maximum fishing mortality threshold (MFMT) is exceeded, a stock is undergoing overfishing. Too many fish are being recruited. To maintain a healthy population, the MFMT must not exceed FMSY.
Similarly, the minimum stock size threshold (MSST) is the biomass number at which the stock population is too low. When recruits bring a stock below the MSST, the fishery is said to be overfished, and a rebuilding plan is required to allow the stocks to regrow.
MSST and Gulf of Mexico Red Snapper
For Gulf Red Snapper
For Gulf Red Snapper, the MSST indicated that the fishery was overfished, when other data suggested it was not. After more than 30 years of finding the fishery was undergoing overfishing, in 2017, NMFS changed the MSST for red snapper, meaning it was no longer believed to live as long or to get as large as once believed. This led to the conclusion that the stock was no longer overfished. 84 Fed. Reg. 7828 (March 5, 2019).
Spawning Potential Ratio
FMPs attempt to set fishing mortality (F) to a rate which, when added to the natural mortality for that stock, will keep stock at a sustainable level (or allow rebuilding if the fishery is overfished). The level used in many management plans is based on the spawning potential ratio (SPR). The SPR informs the principle that in order to have a sustainable population, enough fish have to survive to spawn and replenish the stock.
The spawning potential ratio compares the spawning ability of a stock when subject to fishing to the stock’s spawning ability if unfished. The SPR compares how many fewer eggs are laid when fish are caught before being able to spawn or early in their spawning years compared to eggs produced where the fish die from old age or die of natural causes.
For example, consider 10 fish large enough to be caught (recruited) in the fishery:
- Four are caught before they spawn (no eggs produced),
- Three are caught after they spawn once (some eggs produced), and
- Three are never caught and live to spawn three times (many eggs produced) before dying of old age.
During their lifetime, assume those 10 fish produced 1 million eggs, making the average eggs per fished recruit 100,000 (1 million divided by 10). (We are counting all 10 fish to get a realistic picture, not just the six that produced eggs.)
Compare to 10 fish in an unfished population:
- Three of the ten fish die of natural causes after spawning once (some eggs produced) and
- Seven spawn three times (very many eggs produced) before dying of old age.
During their lifetime, assume those 10 fish produced 5 million eggs and the average unfished recruit produced 500,000 eggs (5 million divided by 10).
The spawning potential ratio for the example above is the 100,000 eggs produced by the average fished recruit divided by the 500,000 eggs produced by the average unfished recruit and is equal to 0.20 or 20 percent.
SPR = 100,000/500,000 = 0.20 or 20 percent.
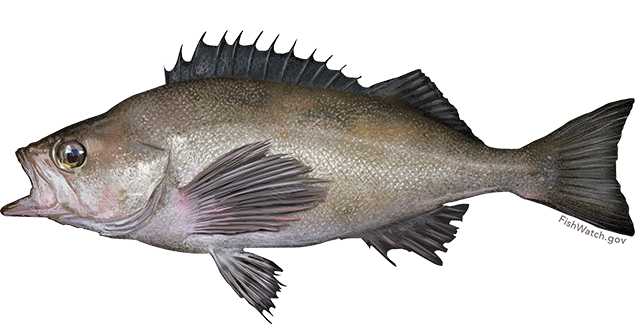 Widow Rockfish
SPR by Biomass
SPR can also be calculated using biomass (weight). To calculate SPR under this method, scientists could use the biomass of the entire adult stock, of mature females in the stock, or of the eggs they produce. These measures are called spawning stock biomass (SSB) or spawning stock biomass per recruit (SSBR), when presented on a per-recruit basis.
In the above example, the weight of fish that contributes to spawning could be substituted for eggs produced to get the SSBR for the fished stock. SSBR (fished) divided by SSBR (unfished) gives the SPR.
The concept of Spawning Stock Biomass illustrated in the graph shows the biomass of a stock at each age in the unfished condition compared to the weight of the stock when SPR = 20%. The adult fish in this stock spawn at age four so only the weight of fish four years and older contribute to the spawning stock biomass.
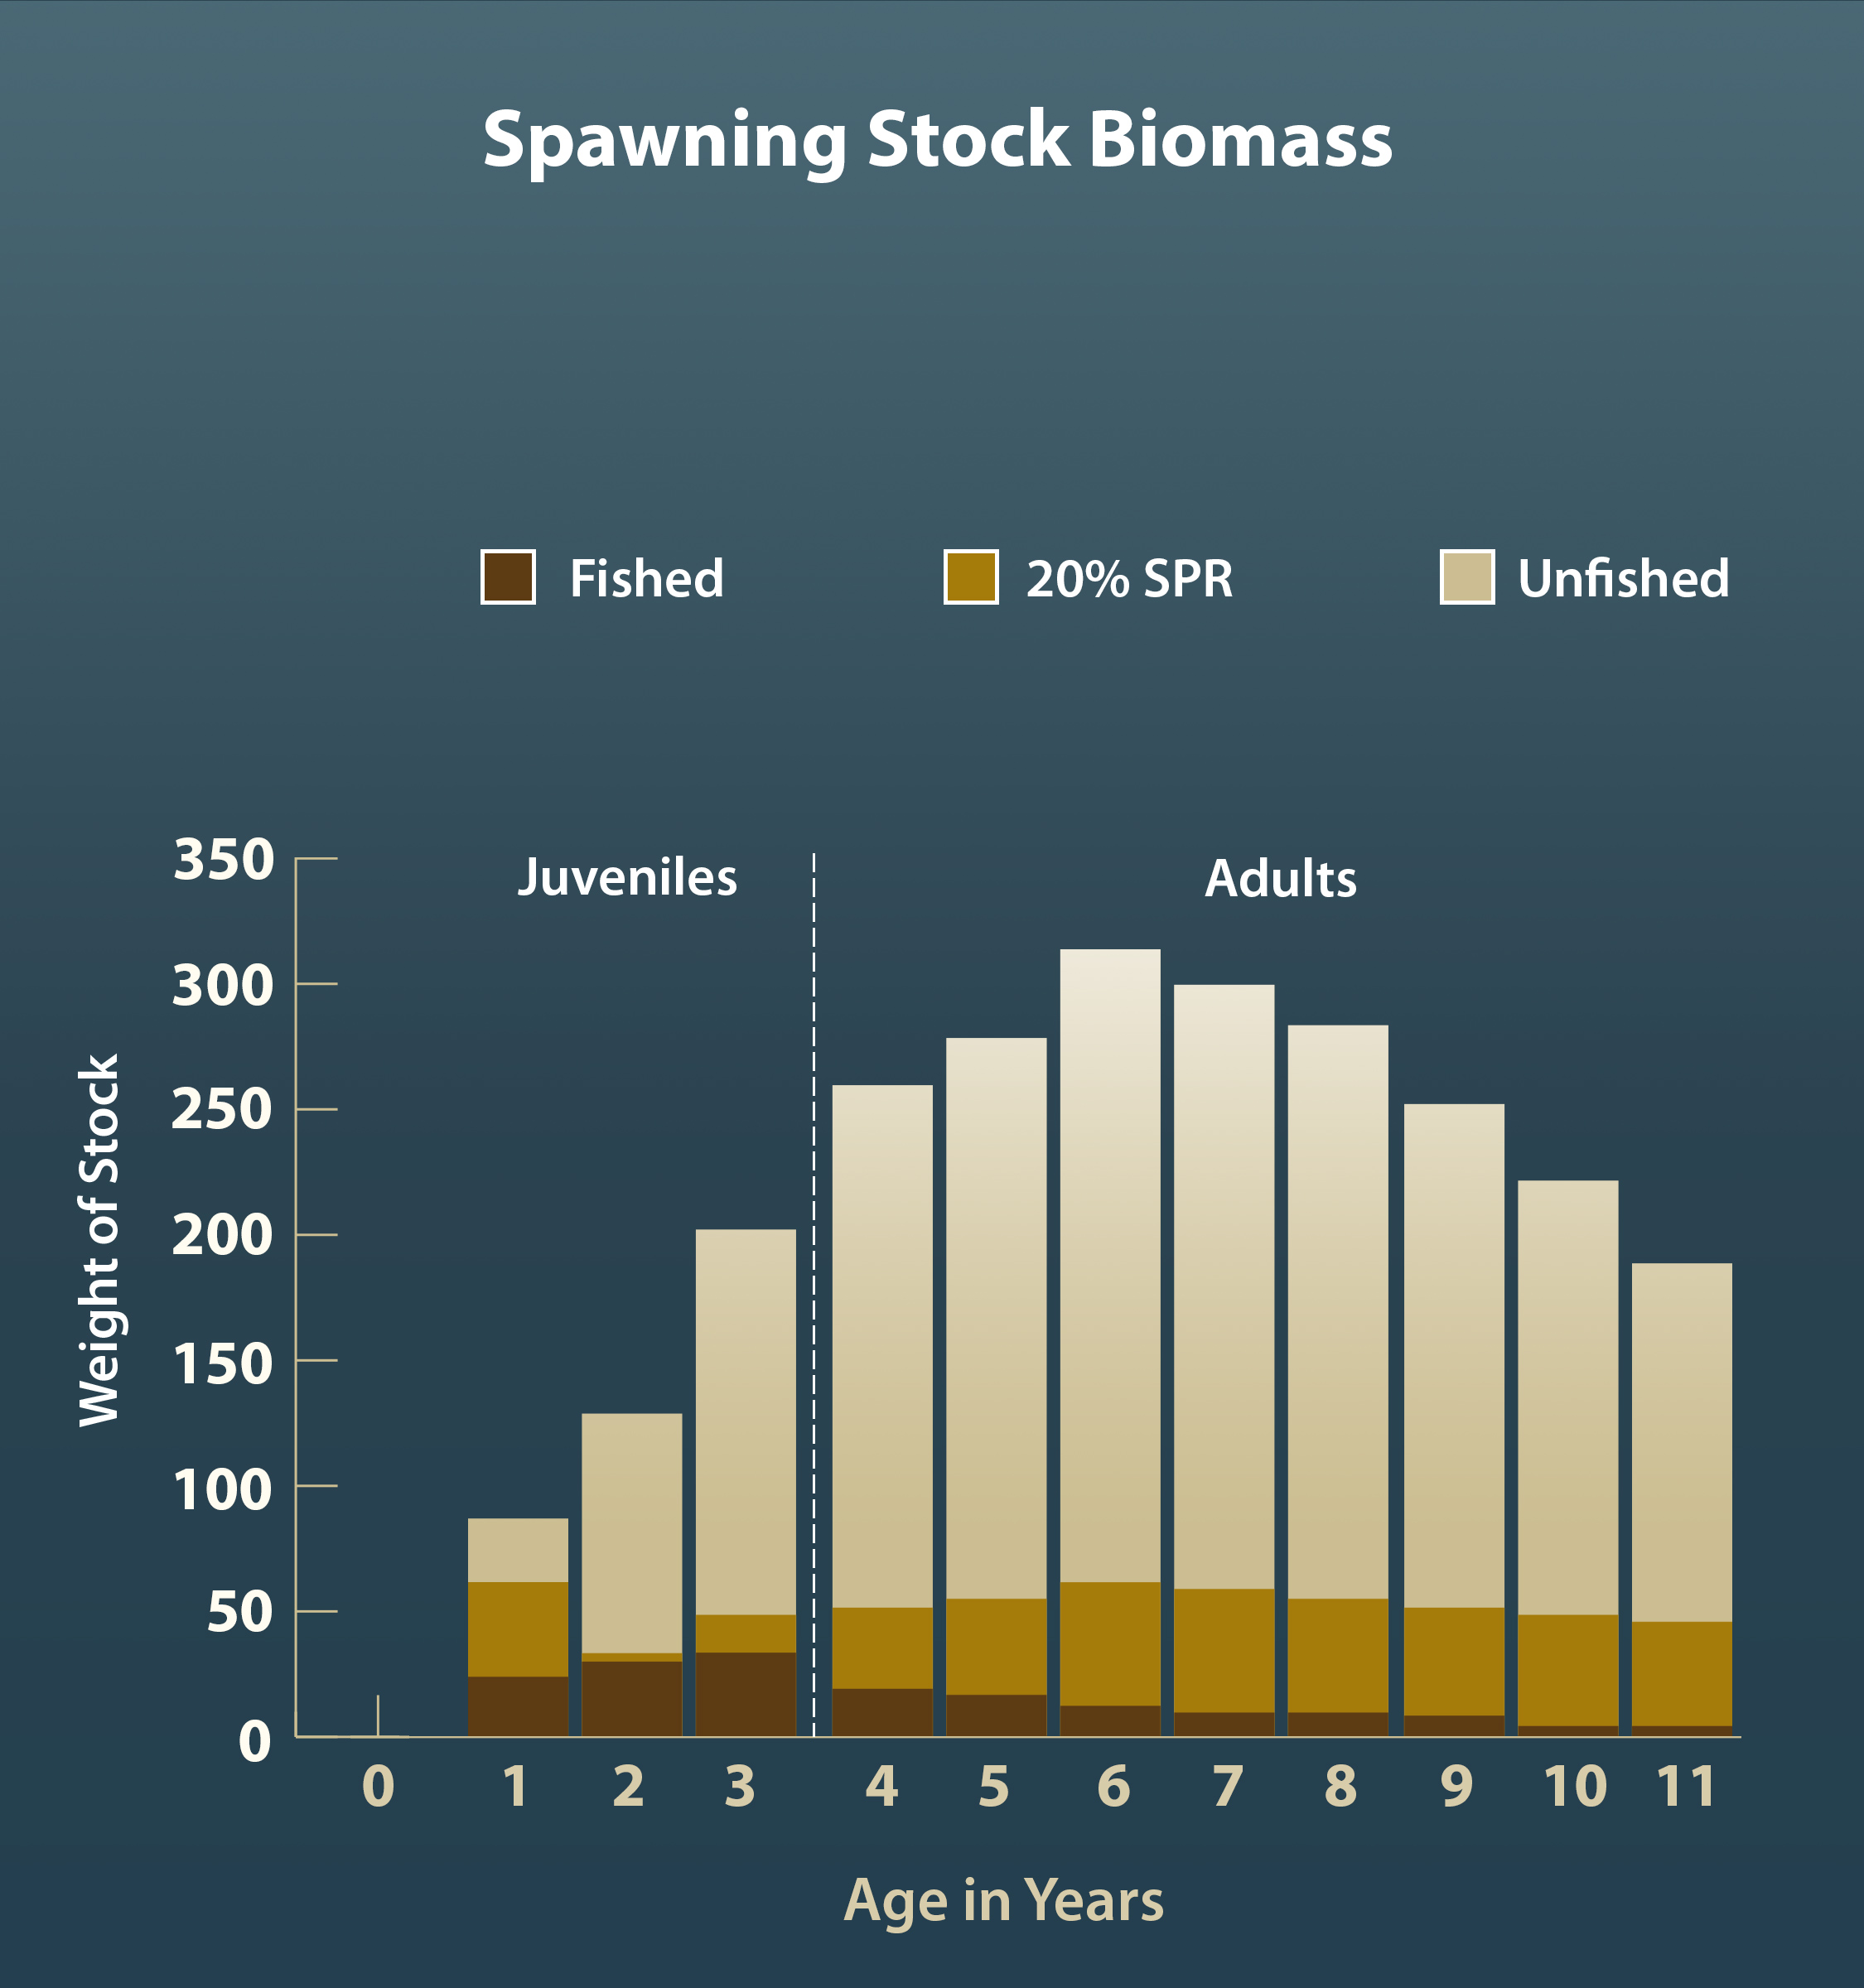
In a perfect world, fishery biologists would know what the appropriate SPR should be for every harvested stock based on the biology of that stock. Generally, not enough is known about managed stocks to be so precise. However, studies show that some stocks (depending on the species of fish) can maintain themselves if the spawning stock biomass per recruit can be kept between 20 - 35% (or more) of what it was in the unfished stock. Lower values of SPR may lead to severe stock declines.
FMP where MSY Is Unknown
In the case of gray snapper in the Gulf of Mexico, the Scientific and Statistical Committee (SSC) was unable to determine whether the stock was overfished due to a lack of data. Because the actual MSY could not be determined, NMFS used a proxy (a substitute) for MSY. NMFS used the SPR as the proxy to establish the appropriate fishing mortality rate to achieve optimum yield.
Applying Fish Mortality within a Fishery Management Plan
Fishery management does not have a method to reduce natural mortality. Therefore, if the SPR is below the level considered necessary to sustain the stock, then fishing mortality must be reduced in order to have a sustainable fishery. When fishers appear to be catching fish before the fish have a chance to spawn and there are other signs of trouble in the fishery, the usual management response is to put limits on catching small fish. Protective measures most often come in the form of minimum length limits or gear restrictions that favor catching larger fish. One example of a gear restriction is setting minimum mesh size limits for gill nets to allow smaller fish to escape.
Unfortunately, setting size limits to prohibit catching small fish does not necessarily solve the problem of recruitment overfishing. Remember, recruitment overfishing occurs when more fish are being removed than can replace themselves. Overfishing can still occur on the remaining fish in a stock even when the small fish are protected because small fish produce much fewer eggs than large fish. For example, where a mature red snapper produces 350,000 eggs a year, but an older larger red snapper produces 120 million eggs a year, saving the smaller fish will have only limited success at rebuilding the stock. Some advocate putting both a minimum and a maximum fish size on harvests to allow the large fish to continue producing massive quantities of eggs.
An additional problem with minimum length limits is that if the length is set too high the discard rate will increase. More discards means a higher discard mortality, as many fish die after being released.
Fishers sometimes suggest closing the fishing season when a stock is spawning but otherwise to put no limits on landings based on size. The idea is generally rejected by biologists because it only works once. While prohibiting fishing during the spawning season allows for a full spawn that season, the fish caught after they spawn can never spawn again. Instead, biologists focus on protecting fish until they are old enough to spawn and then determine how many fish can be safely removed without harming the stock. In theory, this approach enables enough fish to survive and remain in the population to spawn multiple times.
Other options to protect fish are marine protected areas or marine reserves.
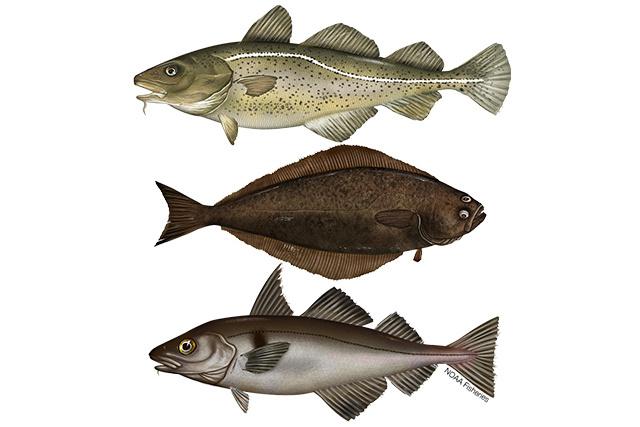 Northeast Multispecies Groundfish
Knowing the spawning ratio and fish mortality rate and other data points is important to setting the catch limits. But science is not the only factor in setting catch limits. The MSA requires an FMP to consider the impact on the fishing community (National Standard 8), for example, or the economic efficiency in using resources (National Standard 5). Here’s an example of how those factors can fit together, taken from a Northeast multi-species groundfish fishery that required rebuilding due to overfishing.
Three options were considered on how to implement F, the annual fishing mortality rate for the species.
- Option one would limit catches to F immediately during the entire rebuilding period, but this would have “severe consequences for fishing communities” because they would not be able to catch enough to maintain profitability. 69 Fed. Reg. 22906, at 22920 (April 27, 2004).
- Option two would drop catch rates to maximum sustainable yield (FMSY), and then after five years, drop catch rates further to F, to allow rebuilding.
- The third option starts with catch rates greater than FMSY. In two to five years, the rates would be lowered to FMSY, and eventually the catch rates would drop below FMSY to allow for rebuilding.
While options two and three would do little to help rebuild the stock for at least two years, they would help end overfishing over time without putting fishers out of work. NMFS’s decision to use those options was challenged in court. In the case of Oceana, Inc. v. Evans, 2005 WL 555416 (D.D.C. March 9, 2005), the court allowed NMFS to adopt the second option for seven species, and the third for five species, even though the first option would rebuild the stock more quickly.
Standards for Rebuilding Plans
Courts have held that management measures do not need to achieve FMSY every year. However, to comply with the MSA, an FMP must achieve FMSY over the long-term. For example, one court allowed an FMP that would result in a high stock mortality in the early years of a rebuilding plan (for Atlantic bluefin tuna) and reduce it later to allow populations to rebuild because NMFS determined it was economically desirable and easier to administer. National Audubon Society v. Evans, 2003 WL 23147552 (D.D.C. July 3, 2003).
However, there are limits. A court of appeals rejected a rebuilding plan for summer flounder with an 18 percent likelihood of success, finding it did not meet the National Standards. NRDC v. Daley, 209 F.3d 747 (D.C. Cir. 2000). See also, Coastal Conservation Ass’n v. Gutierrez, 512 F. Supp. 2d 896, 900 (S.D. Texas 2007) (rejecting 27-yr rebuilding plan for red snapper in part because it had less than a 50 percent chance of success).
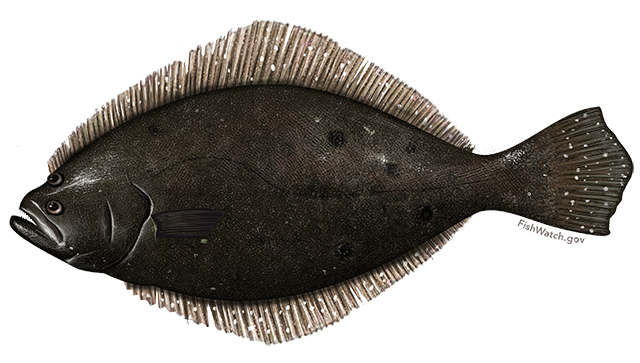 Summer Flounder
Virtual Population Analysis (VPA)
Fishery biologists also can determine fish population based on interpreting data. For example, biologists can reconstruct the size of a year class by virtual population analysis. When the number of fish caught from a single year class is known for each year that the year class is fished, biologists can use that number and the mortality rate to reconstruct the size of the year class. The term “year class” refers to the group of fish born in the same year. For example, if 1,000 of the fish born in 2008 (2008 year class) were first harvested in 2010, 900 the second year, 800 the third year, 700 the fourth year, and 600 the fifth year, then there had to be at least 4,000 fish alive (1,000+900+800+700+600) in the 2008 year class when fishing started in 2010.
The estimate of what size the 2008 year class was based on data available in 2014 looks like this:
X = unknown size of 2008 year class
- 1000 (2010)
- 900 (2011)
- 800 (2012)
- 700 (2013)
- 600 (2014)
Total of fish harvested since first harvest of year class:
4,000
Therefore, X (the number of fish in 2008) is greater than 4,000. In other words, there had to be at least 4,000 fish in 2008 in order to have fished/recruited the reported number of fish in 2010-2014.
Using Catch to Estimate Population
If the natural and fishing mortality rates are known or can be estimated, then the number of fish that should have been alive in the year class to produce the catch of fish can be calculated, as described in the example below.
Example, Step One: If 600 fish were caught in 2014, there had to be more than 600 fish alive at the end of 2013: some would have died of natural causes during 2014, and fishers are unlikely to catch 100% of the fish in a year class (that would mean a fishing mortality of 100%).
Step Two: Assume that natural mortality equaled 20% and fishing mortality also equaled 20% (to be mathematically correct, these would be converted to instantaneous mortality). In this example M = F.
Step Three: Under the assumption that M = F, since a 20% fishing mortality (F) removed 600 fish from the stock, then a 20% natural mortality (M) also would remove 600 fish from the stock. Therefore, at least 1,200 fish were alive at the end of 2013.
Step Four: However, not all of the fish that were alive at the end of 2013 were caught or died in 2014. Therefore, there must have been more than 1,200 fish alive at the end of 2013. Divide 1,200 fish by the total mortality rate (20% F + 20% M = 40% Z), or 1,200/0.4, to find that 3,000 fish were alive at the end of 2013.
Step Five: This process can be continued backward until the total number of fish in the 2008 year class is estimated. The reconstructed year class then can be tested with different rates of fishing mortality to see what the effects might be, or the information can be used in other calculations such as determining the spawning stock biomass.
Modeling Methods to Assess Stock
A virtual population analysis was a common way to assess the health of a stock until the late 1990s when Age Structure Assessment Program (ASAP) began. The ASAP model filled in some data gaps, such as gear-specific catch-at-age for all years. ASAP was found to lack consistency for assessments over long periods of time, however, leading to the Catch-Error Model (CATCHEM) as the favored model in the early 2000s. In the early 2010s CATCHEM fell from favor and Stock Synthesis (SS) modeling was used. SS is described as a model based on catch-at-age. It is a combination of three models: population dynamic, observation, and the statistical likelihood of a result.
« Go to Part 5 | Part 6: Assessing the Mortality and Spawning Potential Ratio (SPR) | Go to Part 7 »